
The Journal · Knight Data Services
Making it meaningful
Rodney Pritchard has spent 20+ years building behavioral health technology. This time: a Florida BHCon talk on turning vision into reality, and the Reporting Desk where we've watched it happen.
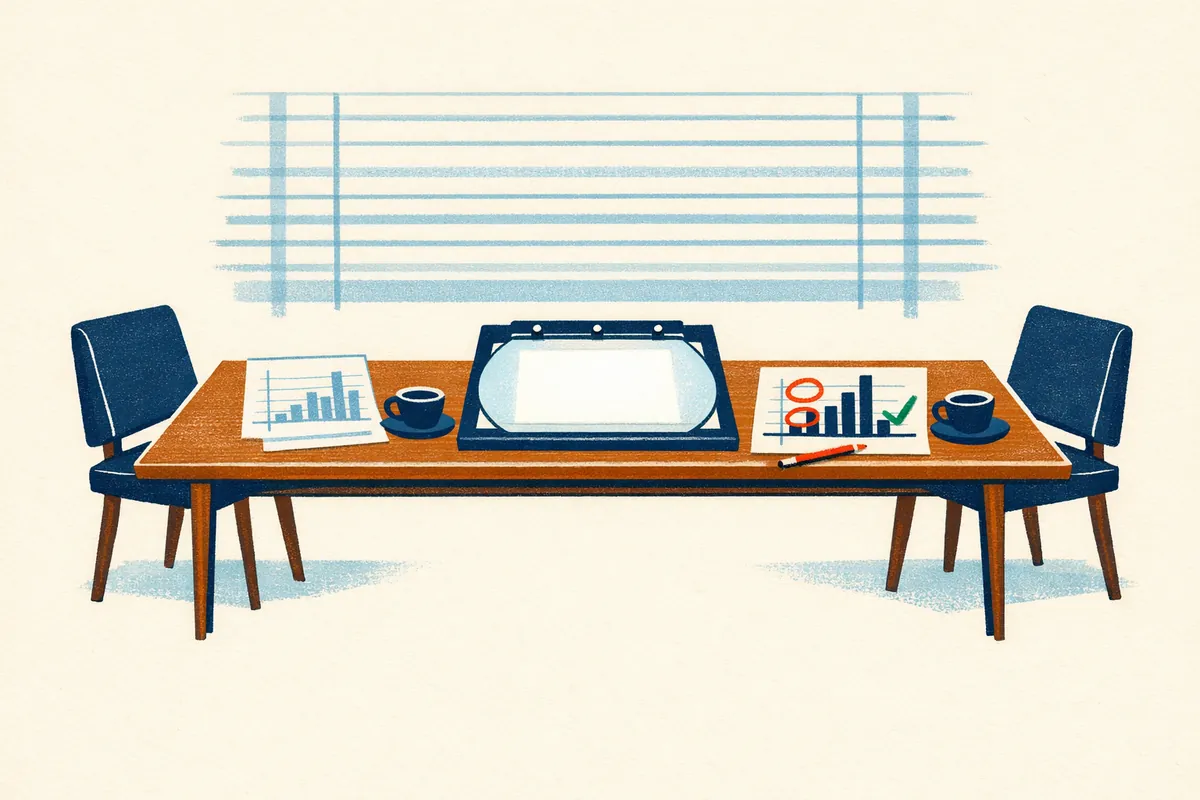
Every behavioral health agency has more data than it uses. Most of it ends up in reports nobody reads.
Concetta Hillman, LCSW-QS, is the Operations Manager at Clay Behavioral Health Center. At Florida BHCon this year she presented From Vision to Reality, a method in four steps: Decide with intention, Develop with flexibility, Do with confidence, and let Data guide continuous improvement. Her handouts are some of the most practical tools we’ve seen for turning an idea into a working practice.
We’ve been on the other side of the table for that method for months. Knight Data Services works with Clay on state reporting, with dashboards powered by Vellum, a Knight Software platform, and that work grew into a standing meeting on Clay’s calendar called Concetta’s Reporting Desk. We asked Rodney how it started, and what her process looks like from where he sits.
How did the Reporting Desk come about?
“Through our data services work at Clay. We’d been working with Clay on state reporting. But as the demands for accuracy and analytics in state reporting have grown, they’ve pushed us outward, to look at organizations more holistically. And we’ve wanted to keep offering more to our clients.
“We’re so deep in the data that the reporting is, in some cases, the smaller lift for us. Once we’ve made the data available, mined it out and charted the database, bringing it back to the client is almost the easy part. Making it meaningful is the hard part, and that’s where Concetta came in. We started a recurring meeting to put the reporting we could build from their EHR to work.”
Decide: no data for the sake of data
The first page of her method is a decision map: what will be different in a year, what problem you’re solving, and how you’ll know you succeeded. Only then comes scope, and what’s deliberately left out of it.
What did she bring that a data team wouldn’t think of alone?
“As analysts, we just love to bring information to the table. Concetta says, ‘I don’t like a dog and pony show,’ and ‘I don’t like data for the sake of data.’ She’s great at pushing us to make sure the data we make available is going to serve the organization, and serve our time.
“So we narrowed the productivity reports, to make sure they accurately show each department’s administrative burden and its real productivity. And she pushed us deep with the Med Management team, to study compliance on treatment plans, quarterly POMS, annual FARS and annual evaluations.
“She helps us take the huge amount of data we have and pick the pieces that will actually bring about change, on an operational level, and at the level of systems of care and levels of care. She’s an operations manager who’s also a licensed clinician, and that perspective is invaluable.”
“Providers aren't late or out of compliance because they want to be. It's usually because they don't know.”
Develop: pen to paper
Her second handout is a pilot checklist, and it has a line we keep coming back to: we are ready to learn, not prove we’re right.
At Clay that looks like this. When she asked for a report spanning clients served by more than one program, the first version went live the same day.
Within the week she’d checked it against her own numbers, and one column changed twice on her suggestions until it asked exactly the right question.
Some vendors would see a week of changes as proof the first version was wrong. How do you see it?
“My mantra with data work is to put pen to paper. I don’t want to deliberate it to death, or meet it to death, or fall into the old software development traps that only delay results.
“I think of correction as a benefit to everybody. When we create a report and get numbers in front of us, it pushes the whole team to scrutinize those numbers. If we’d met and theorized for weeks, we’d have missed so much valuable information that could have been reported right away.
“So the first version needed changes. Most first versions do. Reporting isn’t meant to be a one-shot. It’s meant to grow from its results.
“Concetta works with us that way. She looks at our reports and guides us in, and I know we move faster together because we get reports out as quickly as possible, knowing it’s a refinement workflow.”
And once the numbers were right?
“Nailing the reports down took a few rounds of reviewing the data together, to make sure we were measuring the right populations and had the right expectations. That meant individual chart reviews, comparing what we saw in a chart against what we were pulling systematically.
“Then we built a proper network of distribution, to get the information back to the team leads who can work with their teams to make sure the work gets done.”
Do: no surprises
The third handout is a huddle guide: collaborate, clarify, create consistency, continue forward. The Reporting Desk is that huddle, and what comes out of it lands in team leads’ inboxes: their own compliance list, on a regular schedule.
What’s on those lists, and why does it work?
“We see this at almost every provider. Providers aren’t late or out of compliance because they want to be, or because they don’t care. It’s usually because they don’t know, or they’re overwhelmed with priorities.
“So our list is very direct. Here are a few things that need to be done. We give them a runway of when things are coming due, and a list of what’s incomplete. That way they don’t have surprises, we don’t have surprises, and there’s transparency on all sides.
“Providers often raise their compliance rates quickly. Across the providers we work with, we’re watching the rates keep going up, and some teams have reached 100%, with everything complete, in a short amount of time.”
Reports that explain themselves
Clay’s reports carry a “How this report works” panel, and the same explanation travels in their Excel downloads. Why does that matter so much?
“Those buttons were almost inspired by Concetta. She’s wonderful at picking apart the details, and she pushed us to publish ours. That’s as much for us as for her team. We build a lot of reports for a lot of providers who want similar things, with slightly different data, priorities and teams. It’s hard to remember every detail off the top of your head.
“So we always publish how each report works, as a narrative and as the technical details. It protects us from ourselves. It’s valuable for auditors, it keeps us from making changes that don’t need to be made, and it lets us answer with confidence. When someone asks where a number came from, we can say exactly where, instantly, instead of ‘let me go check.’”
Data: informs, never replaces
Her last handout separates two questions every report should answer. Are we following the workflow we agreed on? And is the workflow working? It ends with a sentence that belongs on every dashboard: data informs leadership; it does not replace it.
At Clay you can watch both questions being asked. The workbook that lands in Clay’s inboxes on a regular schedule has grown report by report, from Med Management due dates to child welfare reviews. Every send now opens with an Achievement Spotlight of recent wins, because celebrate progress is on her list too.
When a number looks bad, how do you tell a people problem from a workflow problem?
“We treat reports as red flags, as indicators. That’s what most operational and compliance reports are: the first step in addressing something. We can present the data and we can work with staff, but it takes a leader to bring about change on the ground. The leader knows how to approach staff and team leads, and when to address something one-on-one or as a team.
“And it takes a leader to know that data isn’t something to use against staff. It’s something to share with your team to bring about the change we all want to see. I think the first step in making sure data isn’t used as a weapon is believing in the people the data represents. Then the whole approach is shaped by collaboration, not opposition.”
What it gives everyone else
Has this work changed Vellum itself?
“Everyone we work with shapes the product. Clay and Concetta have had very direct input on our self-explaining reports and on how we distribute them.
“But every provider has changed something. Great input from other providers shaped our benchmarking tables, so our reports can be compared month over month and year over year. We’re never looking at a snapshot in time anymore. We see it relative to where we were before.
“One of the things I love about our data warehouse is that it’s becoming so uniform that every change or idea from one organization benefits the whole group. When we learn a lesson at CHI or at another agency we serve, we carry it into our work at Clay. And what we learn from Concetta and Clay, everyone gets.
“That’s why we value our one-on-one time reviewing reports with each provider so much. It strengthens everyone, and Vellum gets stronger as a whole.”
What travels between agencies is the lessons and the methods. Each agency’s data stays its own, and Vellum reads it read-only, always.
Where to begin
What would you tell a leader who wants a dashboard but hasn’t decided what success looks like?
“Success in a dashboard begins with envisioning where you want to be, and what you want the dashboard to look like in the end. Talk with your data provider and the people in charge of your data. They’re the people you want to see take your vision and build the stepping stones that turn it into reality.
“Our executive dashboard for Clay brings together eighteen reports we’ve built just for Clay, and they stand on more than sixty we’ve built across the agencies we serve. Each one had its own stepping stones. We pictured where we wanted to end up, and we worked together step by step, relentlessly, putting pen to paper and making changes along the way until we got there. That’s my recommendation.”
In the spirit of Concetta’s method, three questions to bring to your next reporting meeting:
- If this report works, what will be different a year from now, and how will we know?
- Can everyone who reads it see exactly how each number is counted?
- Does it go to the people who can act on it, early enough to act?
Concetta’s last handout says data informs leadership; it does not replace it. We’d add that it should make leading easier.
So here’s the question we ask every leader we meet: what does your clinical director wish she could see every Monday morning?
When you talk to us, you talk to the people who built it.
Dashboards powered by Vellum read your EHR read-only, always, and scheduled workbooks arrive with an audited email log.
Or just tell us what's hurting. No sales team, no ticket queue — you'll hear back from Rodney.